The purpose of the testing
This thread is a summary of several threads about the calculation of cure update when immersion curing. These previous threads can be reviewed in full in the following threads:
http://www.smokingmeatforums.com/t/176321/prague-powder-1
http://www.smokingmeatforums.com/t/176415/cure-uptake-with-immersion-brining
http://www.smokingmeatforums.com/t/176954/bacon-curing-validating-the-10-uptake-assumption
There are several immersion curing methods that are regularly quoted on here that use similar methodology - but which use very different initial brine strengths. One of these methods uses a very high initial brine strength (in the range usually associated with injection/pump brining) and relies on a % pickup factor when calculating the final cure concentration in the bacon. The other method uses a relatively low brine strength and relies on an equilibrium of cure being reached between the brine and the meat to achieve the desired final cure concentration.
Each of these brines is being promoted by forum members who are considered by others as being experienced in the process of curing, however as these methods use initial cure concentrations that are so very different from each other it is hard to see how both can achieve results that are within the USDA commercial guidelines for bacon. I have therefore tested both cure methods on two popular cuts of pork and have had the resulting bacon tested at UK government approved food testing laboratory.
Brine #1
The first of these curing brines and the applicable calculation is described in the "Prague Powder #1" thread. This uses a brine which is in the region of 10x the expected resulting residual cure strength - which is commonly used for the commercial production of injected/pumped bacon. The calculation then relies on a known %age of the cure in the brine being picked up by the meat whilst it in immersed in the brine. The UDSA Processing Inspectors Calculations Handbook suggests that this %age is calculated by the increasing weight of the meat as it is immersed in the brine.
Quote from page 22 of the "UDSA Processing Inspectors Calculations Handbook" :
lb nitrite × % pick-up × 1,000,000 = ppm
-------------------------------------------------
lb pickle
Although there are references to this method in the handbook there appears to be a lack of credible evidence that this actually produces a resulting Ppm in line with the calculation
Brine #2
This is an equilibrium brine that is used by Pops6927 and is based upon a lower concentration of a brine that his father used commercially over 20 years ago. This uses a brine strength which is approaching 1/10th the concentration of Brine #1, however, like Brine #1, there appears to be a lack available evidence to demonstrate the resulting residual cure using this method.
Brine formulations
The calculations from the threads use the following conversions when calculating the metric equivalents
1 US gallon = 3.78 litres
1 Cup of sugar = 240 g
1 Cup of salt = 273 g
1 Tbs Cure#1 = 17 g
Cure#1 = 6.25% Nitrite and 93.75% Sal
In the original threads I was showing the cure in mg/Litre however below these have been converted to mg/Kg for the purposes of calculating Ppm
Brine #1 - as discussed by DDF in the Prague Powder #1 thread
Brine #1 has a starting Nitrite concentration of 9.38 g in 5..47 Kg of final brine = 1,716 mg per Kg = 1,716 Ppm
Brine #2 - Pops Low Salt Brine
Brine #2 has a starting Nitrite concentration of 1.41 g in 5.52 Kg of final brine = 255 mg per Kg = 255 Ppm
The method
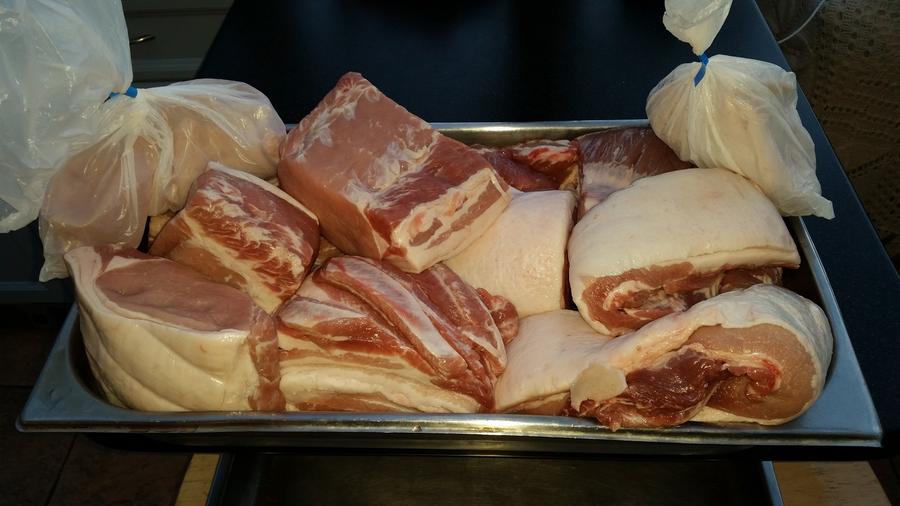
Whole pork belly and a whole Pork loin were each taken from a single pig (in order to minimise biological variation) and each of these were cut into joints of roughly 1 Kg each. Each of the brines were then tested using both belly and loin joints. One of each was immersed for 7 days and the other for 14 days. At the beginning of the trial a sample was taken from each of the pork cuts in order to measure any background Nitrite levels occurring naturally in the meat.
Single 20 litre batches of each of the brines were prepared and thoroughly mixed until all of the salts were dissolved and the the solutions were totally clear. 5 litres of the appropriate cure was then put into the curing containers for each pork joint. Each pork joint was cured in its own curing container, which had a tight fitting lid.
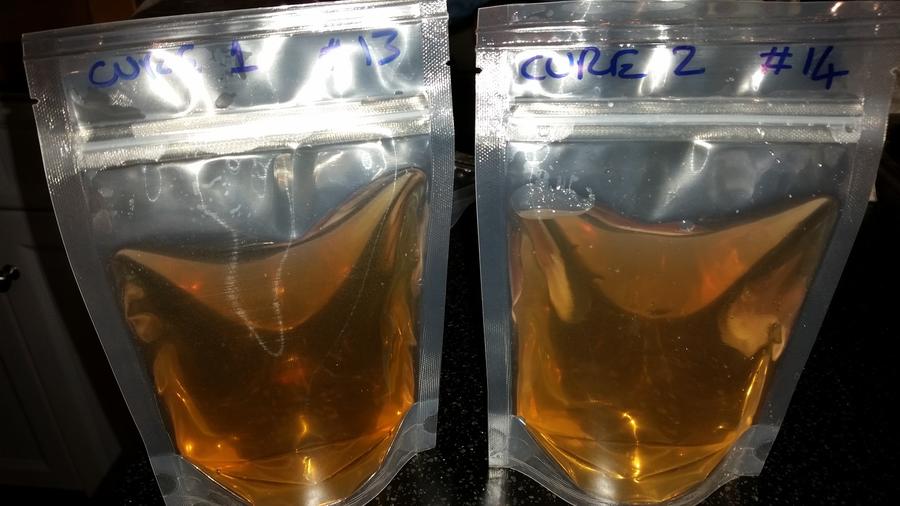
Samples of each of the brines were then taken and frozen, ready for testing
Each pork joint was then immersed in 5 Litres of brine which, in these containers, was "just enough to cover it"
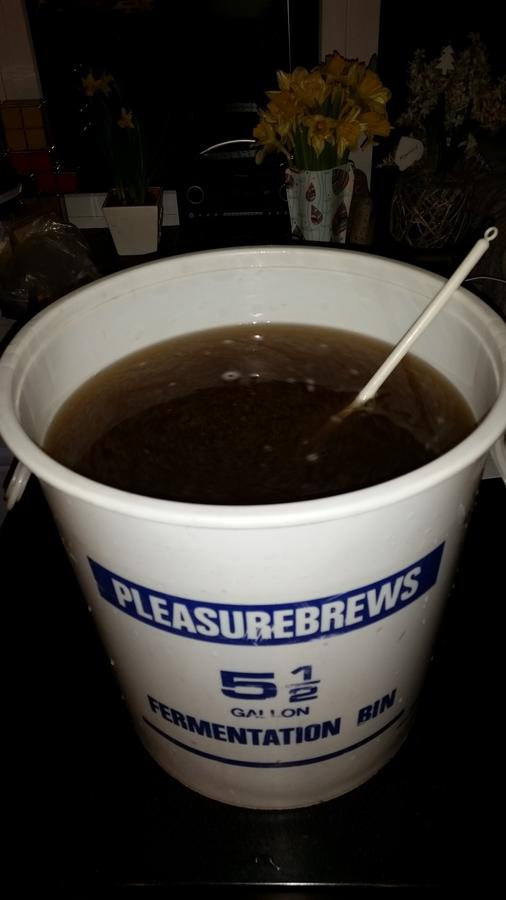
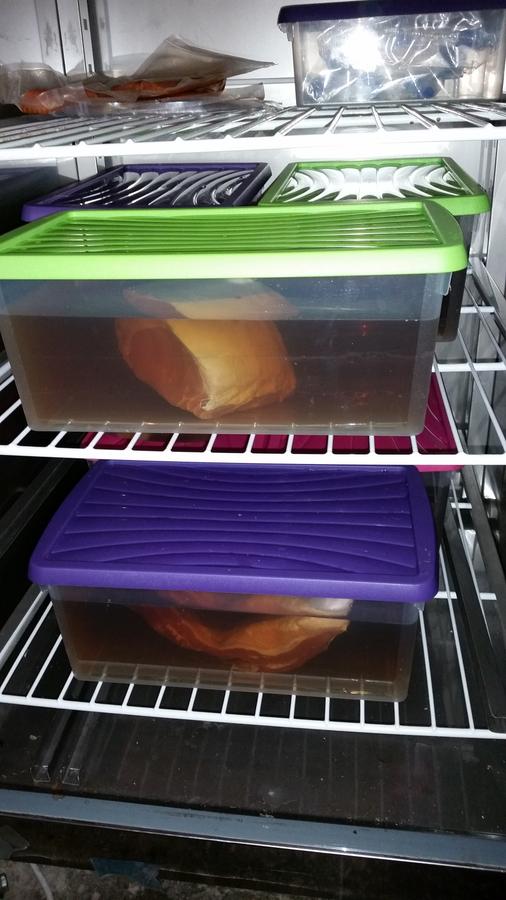
The containers were all then stored in the fridge whilst curing. Some of the containers are shown here.
Each day the joints were moved in the brine and the brine was stirred.
After 7 days one of the loins and bellies from each brine were removed from the fridge, rinsed and dried and then placed on a rack in the fridge for 5 days to allow any cure gradient to equalise. A sample of the brine was also frozen for testing.
After 5 days a meat sample was taken from the centre of each joint which was then frozen ready for testing.
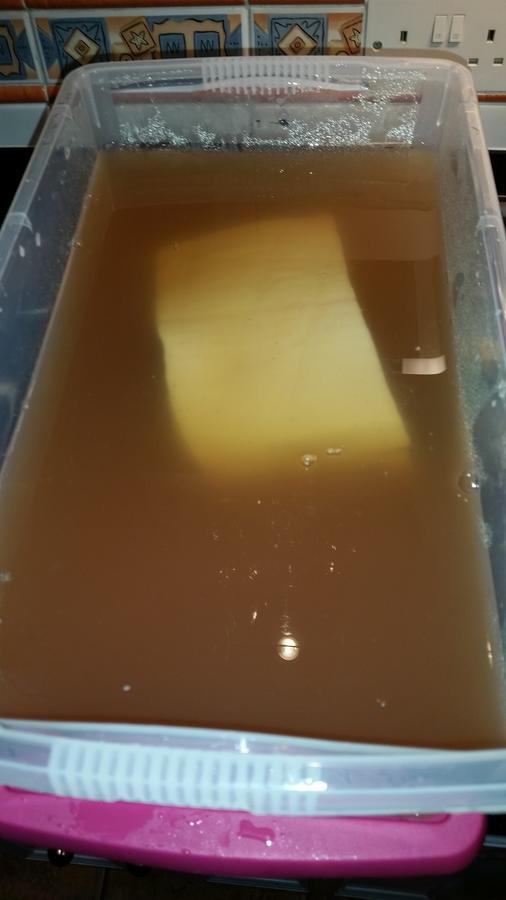
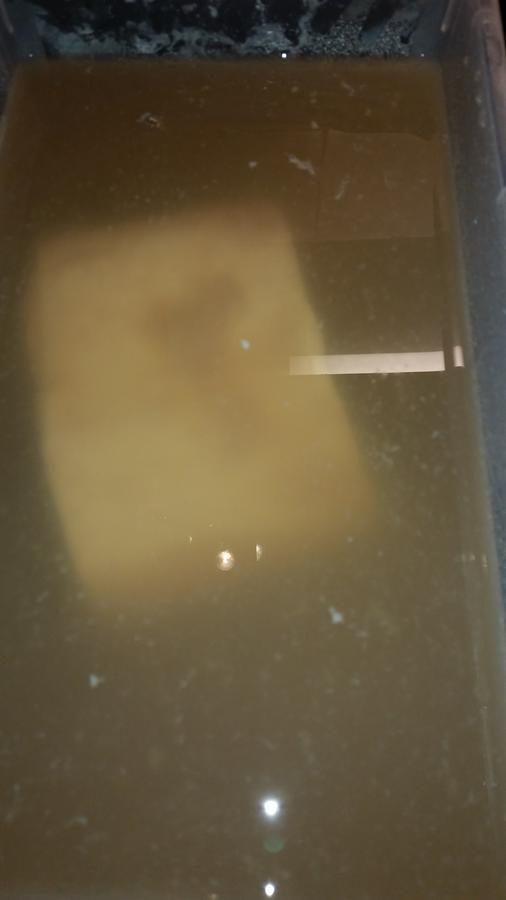
The brine after 7 days looked murky but there were no off smells detectable
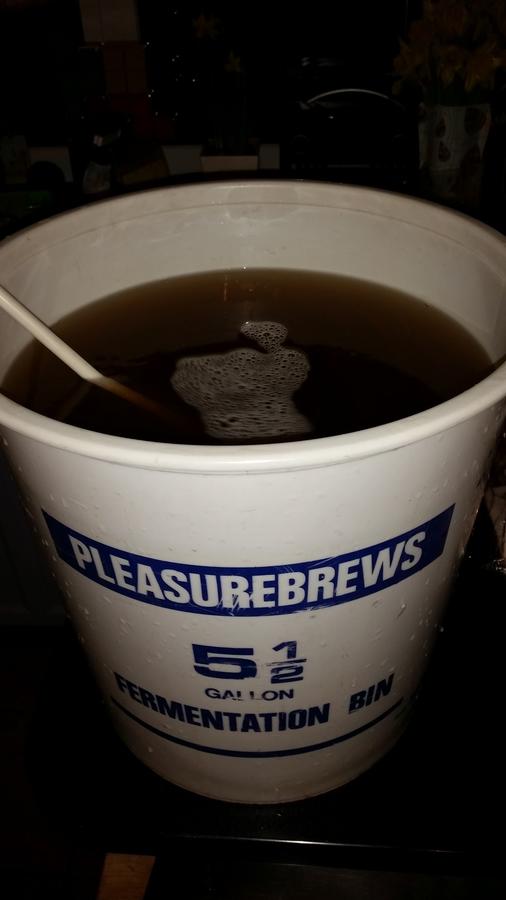
The same was done for the remaining joints after 14 days.
After 14 days all of the brines were looking decidedly murky with a distinct sediment on the bottom of each container. The smell was slightly meaty but was not unpleasant
Experimental results
Lab Test Results
As there is a natural conversion between Nitrite and Nitrate in biological systems, as advised by the testing laboratories, Nitrite and Nitrate were measured in each of the samples order to determine the total cure uptake.
Brine #1
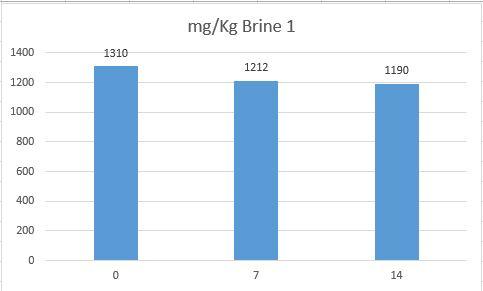
Nitrite/Nitrate concentration in the brine over time. (0, 7 and 14 days)
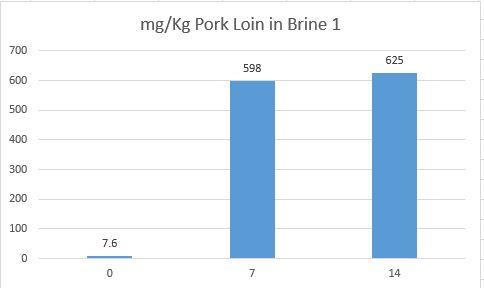
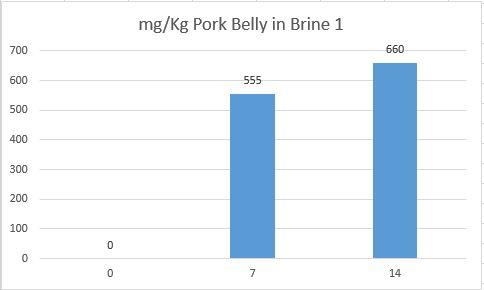
Resulting cure levels in bacon
Brine #2
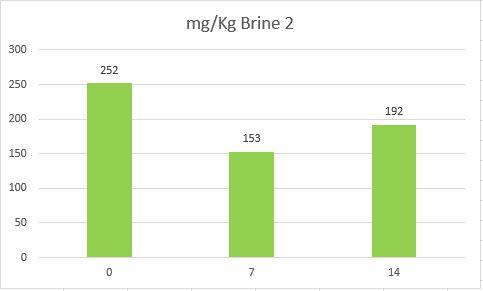
Nitrate/Nitrite concentration in the brine over time (0, 7 and 14 days)
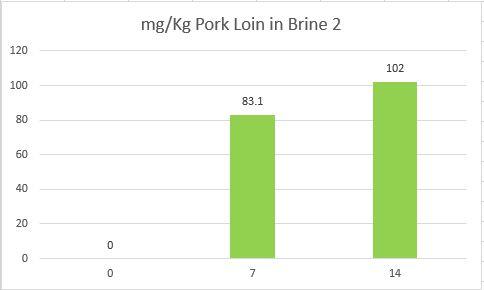
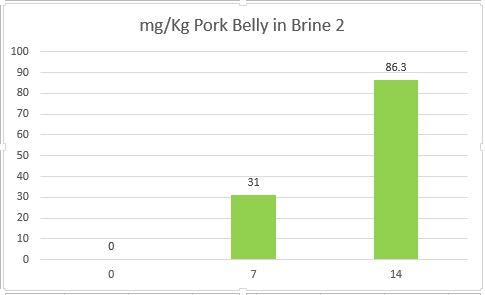
Resulting cure levels in bacon
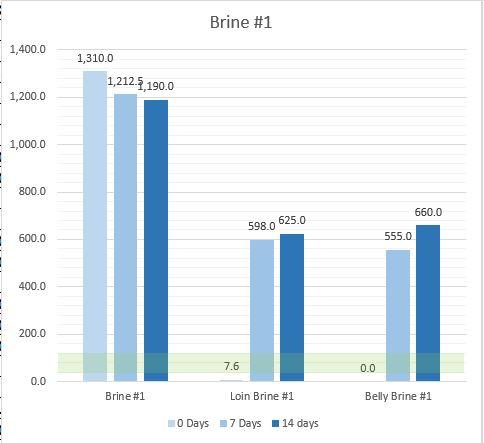
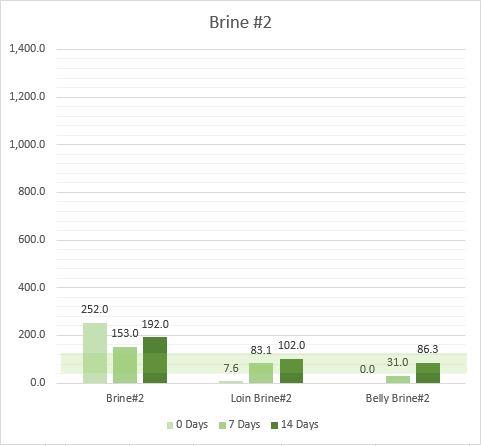
Summary of uptake. The axes have been adjusted to be the same in both graphs to make it easier to directly compare both of the methods. The horizontal area shaded in green is just for reference and shows the nitrite zone from 40 Ppm to 120 Ppm
Conclusions from Lab test data
Updated to add the additional graphs with the same axis scales
This thread is a summary of several threads about the calculation of cure update when immersion curing. These previous threads can be reviewed in full in the following threads:
http://www.smokingmeatforums.com/t/176321/prague-powder-1
http://www.smokingmeatforums.com/t/176415/cure-uptake-with-immersion-brining
http://www.smokingmeatforums.com/t/176954/bacon-curing-validating-the-10-uptake-assumption
There are several immersion curing methods that are regularly quoted on here that use similar methodology - but which use very different initial brine strengths. One of these methods uses a very high initial brine strength (in the range usually associated with injection/pump brining) and relies on a % pickup factor when calculating the final cure concentration in the bacon. The other method uses a relatively low brine strength and relies on an equilibrium of cure being reached between the brine and the meat to achieve the desired final cure concentration.
Each of these brines is being promoted by forum members who are considered by others as being experienced in the process of curing, however as these methods use initial cure concentrations that are so very different from each other it is hard to see how both can achieve results that are within the USDA commercial guidelines for bacon. I have therefore tested both cure methods on two popular cuts of pork and have had the resulting bacon tested at UK government approved food testing laboratory.
Brine #1
The first of these curing brines and the applicable calculation is described in the "Prague Powder #1" thread. This uses a brine which is in the region of 10x the expected resulting residual cure strength - which is commonly used for the commercial production of injected/pumped bacon. The calculation then relies on a known %age of the cure in the brine being picked up by the meat whilst it in immersed in the brine. The UDSA Processing Inspectors Calculations Handbook suggests that this %age is calculated by the increasing weight of the meat as it is immersed in the brine.
Quote from page 22 of the "UDSA Processing Inspectors Calculations Handbook" :
- "The first method assumes that the meat or poultry absorbs not more than the level of nitrite in the cover pickle. Hence, the calculation for nitrite is based on the green weight of the meat or poultry (as is the case with pumped products), but uses percent pick-up as the percent pump. The percent pick-up is the total amount of cover pickle absorbed by the meat or poultry. It is used in the calculation for immersion cured products in the same way percent pump is used in the (previous) calculation for pumped products."
lb nitrite × % pick-up × 1,000,000 = ppm
-------------------------------------------------
lb pickle
Although there are references to this method in the handbook there appears to be a lack of credible evidence that this actually produces a resulting Ppm in line with the calculation
Brine #2
This is an equilibrium brine that is used by Pops6927 and is based upon a lower concentration of a brine that his father used commercially over 20 years ago. This uses a brine strength which is approaching 1/10th the concentration of Brine #1, however, like Brine #1, there appears to be a lack available evidence to demonstrate the resulting residual cure using this method.
Brine formulations
The calculations from the threads use the following conversions when calculating the metric equivalents
1 US gallon = 3.78 litres
1 Cup of sugar = 240 g
1 Cup of salt = 273 g
1 Tbs Cure#1 = 17 g
Cure#1 = 6.25% Nitrite and 93.75% Sal
In the original threads I was showing the cure in mg/Litre however below these have been converted to mg/Kg for the purposes of calculating Ppm
Brine #1 - as discussed by DDF in the Prague Powder #1 thread
| Per 3.5 US Gallon | Per 5 Litres | |
| Cure #1 | 14 oz (397 g) | 150.04 g |
| Brown Sugar | 2-5/8 cups (630 g) | 238.1 g |
| Salt | 3/4 Cup (204 g) | 77.1 g |
| Water | 5 Litres | 5 Kg |
Brine #2 - Pops Low Salt Brine
| Per US Gallon | Per 5 litres | |
| Cure #1 | 1 Tbs (17 g) | 22.49 g |
| Brown Sugar | 1/2 Cup (120 g) | 158.7 g |
| White Sugar | 1/2 Cup (120 g) | 158.7 g |
| Salt | 1/2 Cup (136.5 g) | 180.6 g |
| Water | 5 litres | 5 Kg |
The method
Whole pork belly and a whole Pork loin were each taken from a single pig (in order to minimise biological variation) and each of these were cut into joints of roughly 1 Kg each. Each of the brines were then tested using both belly and loin joints. One of each was immersed for 7 days and the other for 14 days. At the beginning of the trial a sample was taken from each of the pork cuts in order to measure any background Nitrite levels occurring naturally in the meat.
Single 20 litre batches of each of the brines were prepared and thoroughly mixed until all of the salts were dissolved and the the solutions were totally clear. 5 litres of the appropriate cure was then put into the curing containers for each pork joint. Each pork joint was cured in its own curing container, which had a tight fitting lid.
Samples of each of the brines were then taken and frozen, ready for testing
Each pork joint was then immersed in 5 Litres of brine which, in these containers, was "just enough to cover it"
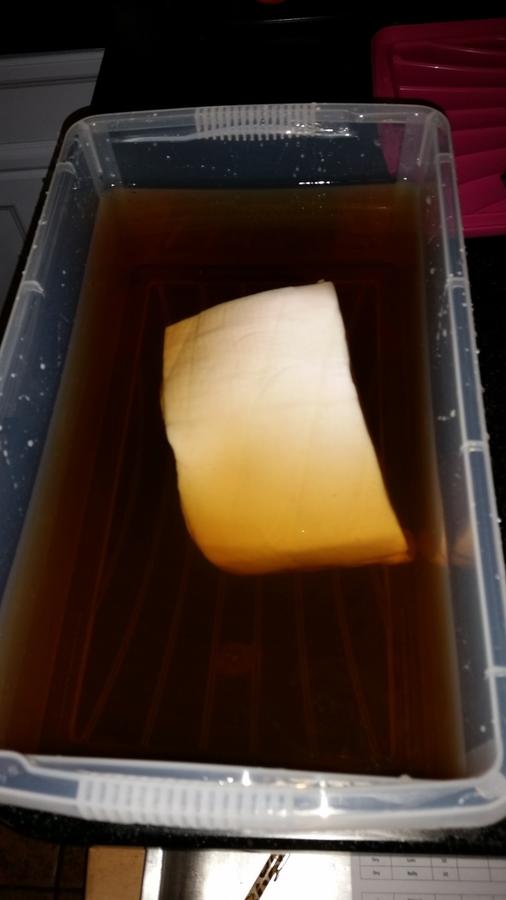
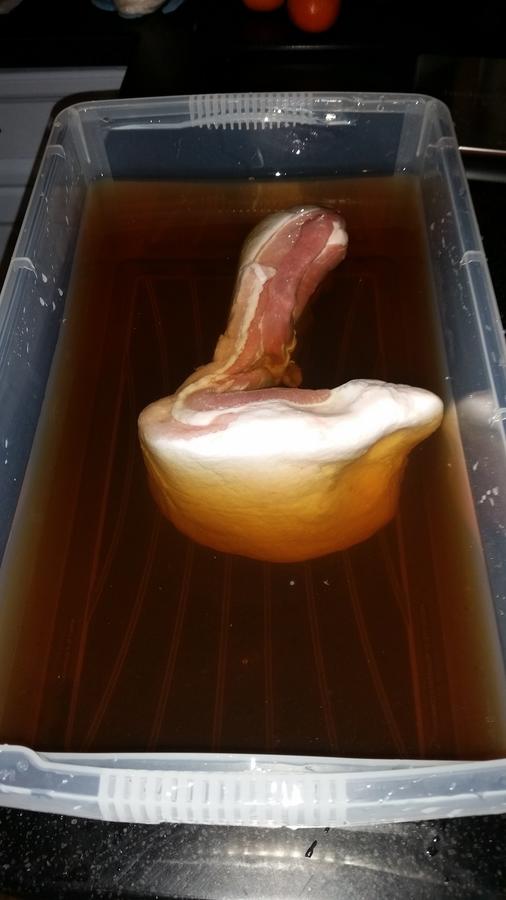
The containers were all then stored in the fridge whilst curing. Some of the containers are shown here.
Each day the joints were moved in the brine and the brine was stirred.
After 7 days one of the loins and bellies from each brine were removed from the fridge, rinsed and dried and then placed on a rack in the fridge for 5 days to allow any cure gradient to equalise. A sample of the brine was also frozen for testing.
After 5 days a meat sample was taken from the centre of each joint which was then frozen ready for testing.
The brine after 7 days looked murky but there were no off smells detectable
The same was done for the remaining joints after 14 days.
After 14 days all of the brines were looking decidedly murky with a distinct sediment on the bottom of each container. The smell was slightly meaty but was not unpleasant
Experimental results
| Brine | Meat | Days | Brine Volume | In Date | In Weight g | Out Date | Weight Resting g | Weight % Increase | Test Sample weight (g) |
| #1 | Loin | 7 | 5 Litres | 02/02/2015 | 977 | 09/02/2015 | 1045 | 6.96 | 206 |
| #1 | Loin | 14 | 5 Litres | 02/02/2015 | 1096 | 16/02/2015 | 1187 | 8.30 | 194 |
| #1 | Belly | 7 | 5 Litres | 02/02/2015 | 1061 | 09/02/2015 | 1178 | 11.03 | 238 |
| #1 | Belly | 14 | 5 Litres | 02/02/2015 | 997 | 16/02/2015 | 1150 | 15.35 | 219 |
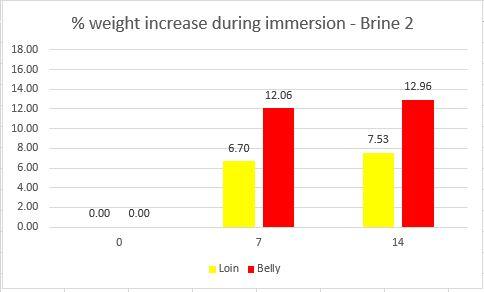
| #2 | Loin | 7 | 5 Litres | 02/02/2015 | 896 | 09/02/2015 | 956 | 6.70 | 227 |
| #2 | Loin | 14 | 5 Litres | 02/02/2015 | 930 | 16/02/2015 | 1000 | 7.53 | 224 |
| #2 | Belly | 7 | 5 Litres | 02/02/2015 | 1086 | 09/02/2015 | 1217 | 12.06 | 226 |
| #2 | Belly | 14 | 5 Litres | 02/02/2015 | 1026 | 16/02/2015 | 1159 | 12.96 | 226 |
As there is a natural conversion between Nitrite and Nitrate in biological systems, as advised by the testing laboratories, Nitrite and Nitrate were measured in each of the samples order to determine the total cure uptake.
Brine #1
Nitrite/Nitrate concentration in the brine over time. (0, 7 and 14 days)
Resulting cure levels in bacon
Brine #2
Nitrate/Nitrite concentration in the brine over time (0, 7 and 14 days)
Resulting cure levels in bacon
Summary of uptake. The axes have been adjusted to be the same in both graphs to make it easier to directly compare both of the methods. The horizontal area shaded in green is just for reference and shows the nitrite zone from 40 Ppm to 120 Ppm
Conclusions from Lab test data
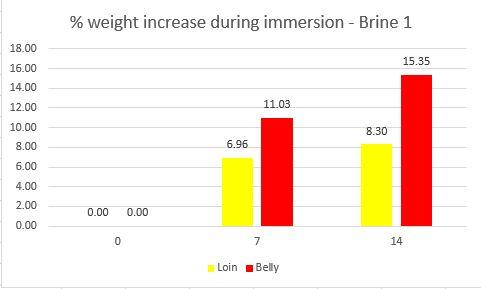
- When immersed the loin and belly joints take up water at different rates - with the belly taking up the most.
- Although the cure concentration in the brine reduced over time, the amount by which it reduced was consistent with an equilibrium being reached between the initial 5 litres of brine and the additional 0.7 litres of water from the meat tissues (meat being approximately 70% water)
- The resulting cure within the meat using Brine #1 (% take up method) was between 550 Ppm and 600 Ppm after 7 days even though the weight increase was between 8%-11%. This level is 3-4 times the residual cure permitted by the USDA.
- The resulting cure within the meat using Brine #2 (Pops equilibrium brine) was between 30 Ppm and 83 Ppm after 7 days and between 86 Ppm and 102 Ppm after 14 days. 14 days of curing in this brine resulted in a cure level which is almost mid point according to the USDA guidelines.
- Based upon these test results, although the resulting bacon is unlikely to be harmful if eaten in moderation, the forum should consider carefully whether it is should continue endorsing the Brine #1 method as the resulting levels of cure were several times higher than the maximum USDA recommendations. At a minimum this should probably not be a method that is recommended to members who are new to curing.
Updated to add the additional graphs with the same axis scales
Last edited: